

Aspire Visual Studio Code extension
The official Aspire extension for VS Code. Run, debug, and deploy your Aspire apps without leaving the editor, with debugging support for C#, Python, Node.js, and more.
Features at a glance
Section titled “Features at a glance”| Feature | Description |
|---|---|
| Run & debug | Start your whole app and attach debuggers to every service with |
| Dashboard | View resources, endpoints, logs, traces, and metrics while your app runs |
| Sidebar | Browse running apphosts and resources in the Activity Bar |
| Integrations | Add databases, queues, and cloud services from the Command Palette |
| Scaffolding | Create new Aspire projects from templates |
| Deploy | Generate deployment artifacts or push to cloud targets |
| MCP | Let AI tools like GitHub Copilot see your running app via the Model Context Protocol |
| Multi-language | Debug C#, Python, Node.js, Azure Functions, and browser apps together |
Prerequisites
Section titled “Prerequisites”- Aspire CLI — Install via the Aspire: Install Aspire CLI (stable) command in VS Code, or follow the installation guide.
- .NET 10 or later — Download .NET.
- VS Code 1.98 or later.
Install the extension
Section titled “Install the extension”- Open VS Code.
- Open the Extensions view (
Command + Shift + X CmdShiftX Control + Shift + X CtrlShiftX Control + Shift + X CtrlShiftX ). - Search for Aspire and install the extension published by Microsoft.
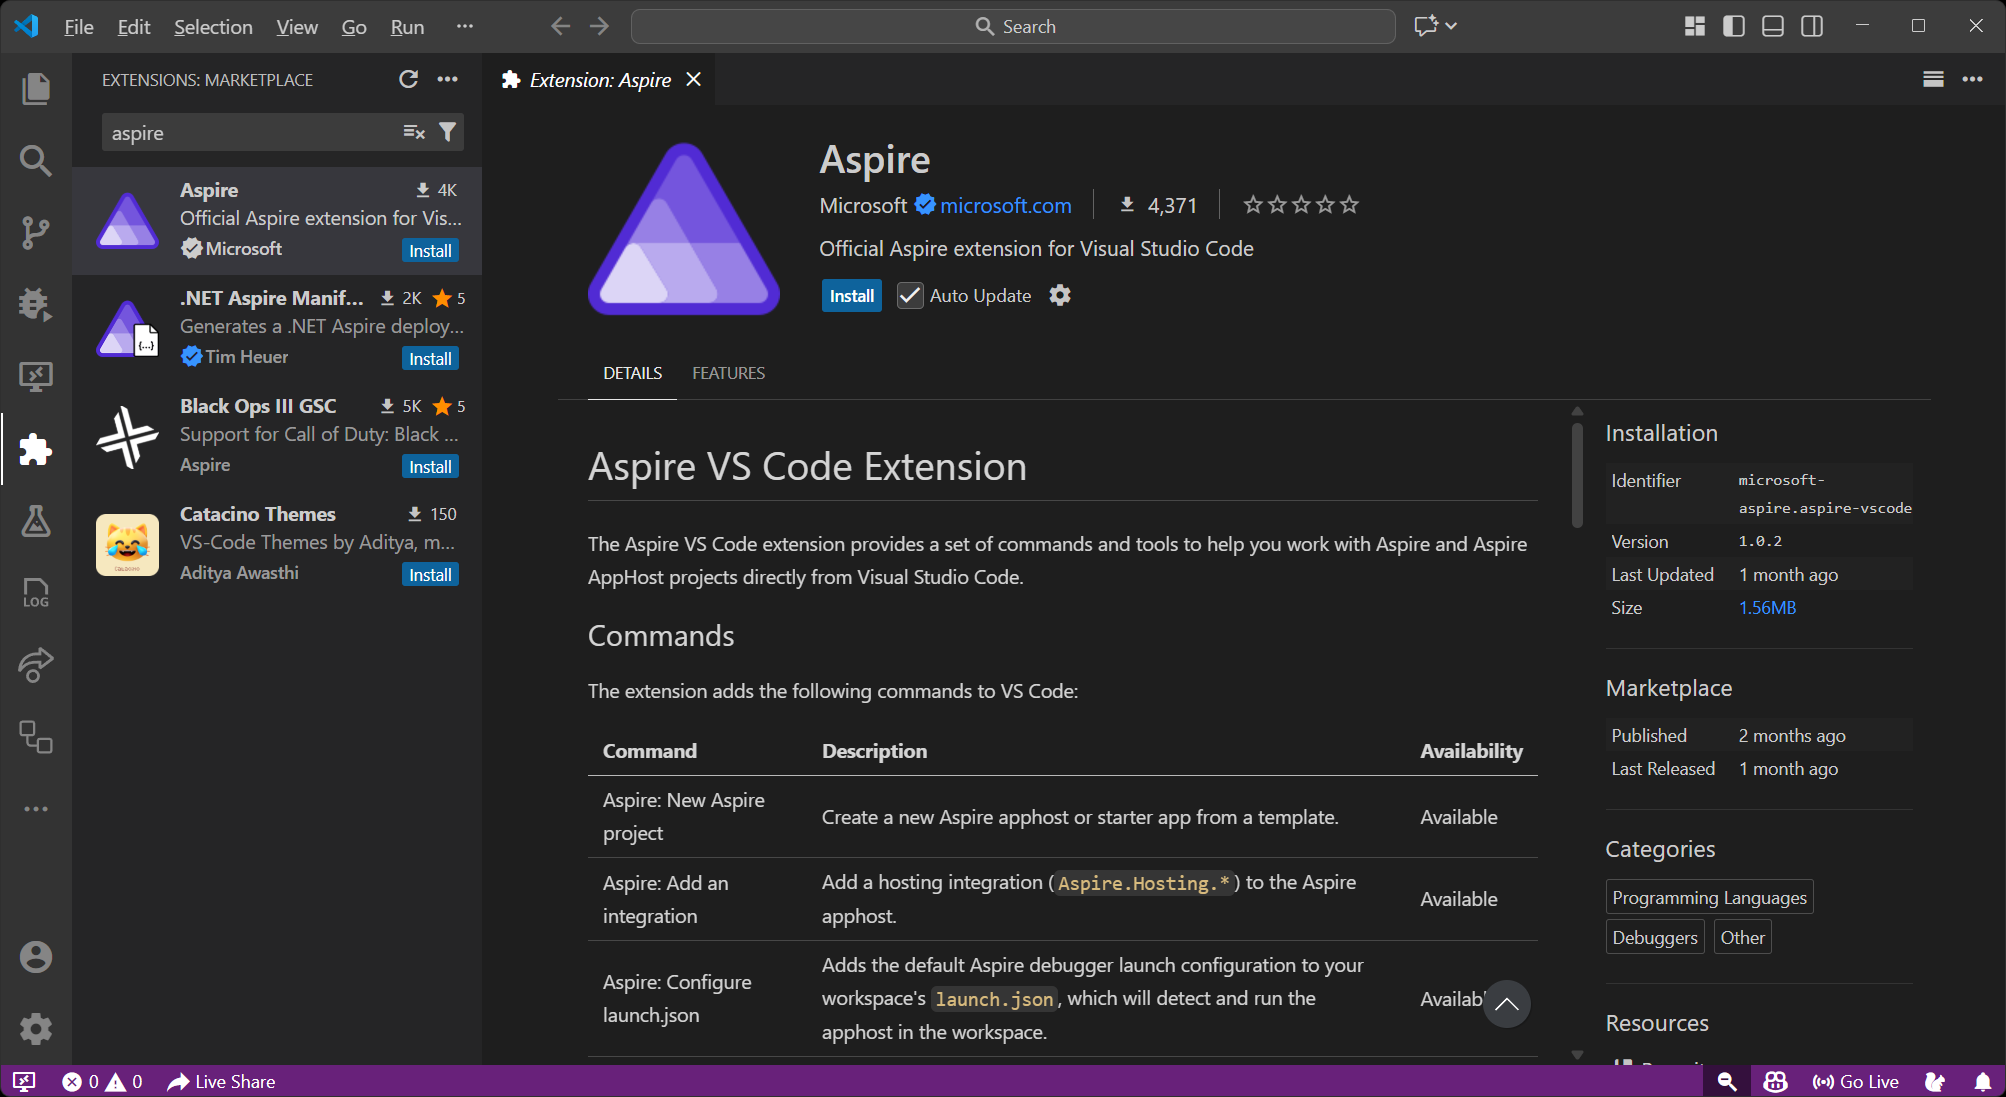
Or install directly from the VS Code Marketplace.
Getting started
Section titled “Getting started”Open your Aspire project in VS Code, or create one with Aspire: New Aspire project from the Command Palette. Run Aspire: Configure launch.json file to set up the debug configuration, then press
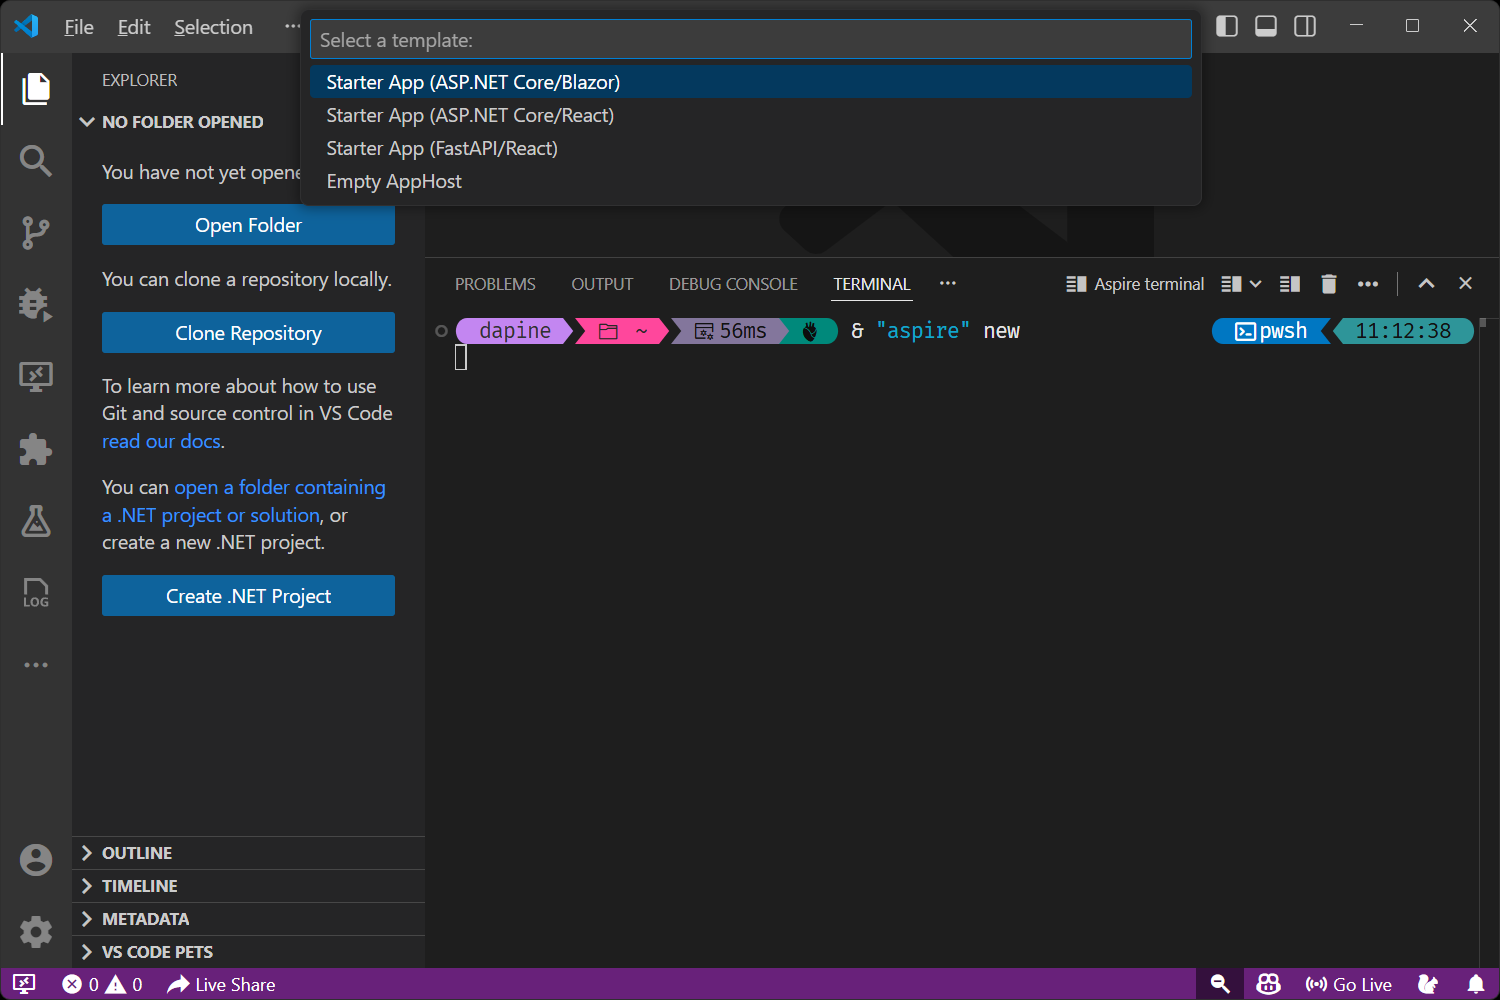
There’s also a built-in walkthrough at Help > Get Started > Get started with Aspire that covers the basics step by step.
Running and debugging
Section titled “Running and debugging”Launch configuration
Section titled “Launch configuration”Add an entry to .vscode/launch.json pointing at your apphost project:
{ "type": "aspire", "request": "launch", "name": "Aspire: Launch MyAppHost", "program": "${workspaceFolder}/MyAppHost/MyAppHost.csproj"}Or run Aspire: Configure launch.json file from the Command Palette to generate one automatically.
When you press
You can also right-click an AppHost file in the Explorer and select Run Aspire apphost or Debug Aspire apphost.
Deploy, publish, and pipeline steps
Section titled “Deploy, publish, and pipeline steps”The command property in the launch config supports more than just running:
deploy— Push to your defined deployment targets.publish— Generate deployment artifacts (manifests, Bicep files, etc.).do— Run a specific pipeline step. Setstepto the step name.
{ "type": "aspire", "request": "launch", "name": "Aspire: Deploy MyAppHost", "program": "${workspaceFolder}/MyAppHost/MyAppHost.csproj", "command": "deploy"}For more information, see Aspire publishing and deployment overview.
Customizing debugger settings per language
Section titled “Customizing debugger settings per language”The debuggers property lets you pass debug configuration specific to a language. Use project for C#/.NET services, python for Python, and apphost for the apphost itself:
{ "type": "aspire", "request": "launch", "name": "Aspire: Launch MyAppHost", "program": "${workspaceFolder}/MyAppHost/MyAppHost.csproj", "debuggers": { "project": { "console": "integratedTerminal", "logging": { "moduleLoad": false } }, "apphost": { "stopAtEntry": true } }}The Aspire sidebar
Section titled “The Aspire sidebar”The extension adds an Aspire panel to the Activity Bar with a live tree of your resources. In Workspace mode you see resources from the apphost in your current workspace, updating in real time. Switch to Global mode with the toggle in the panel header to see every running apphost on your machine.
Right-click a resource to start, stop, or restart it, view its logs, run resource-specific commands, or open the dashboard.
Commands
Section titled “Commands”All commands are available from the Command Palette (
| Command | Description |
|---|---|
| New Aspire project | Create a new apphost or starter app from a template |
| Initialize Aspire in an existing codebase | Add Aspire to an existing project |
| Add an integration | Add a hosting integration (Aspire.Hosting.*) |
| Update integrations | Update hosting integrations and the Aspire SDK |
| Publish deployment artifacts | Generate deployment manifests |
| Deploy app | Deploy to your defined targets |
| Execute pipeline step | Run a pipeline step and its dependencies (aspire do) |
| Configure launch.json file | Add the Aspire debug config to your workspace |
| Extension settings | Open Aspire extension settings |
| Open local Aspire settings | Open .aspire/settings.json for this workspace |
| Open global Aspire settings | Open ~/.aspire/globalsettings.json |
| Open Aspire terminal | Open a terminal with the Aspire CLI ready |
| Install Aspire CLI (stable) | Install the latest stable CLI |
| Install Aspire CLI (daily) | Install the daily preview build |
| Update Aspire CLI | Update the CLI |
| Verify Aspire CLI installation | Check that the CLI works |
Language and debugger support
Section titled “Language and debugger support”The extension detects each resource’s language and attaches the right debugger. Some languages need a companion extension:
| Language | Debugger | Extension needed |
|---|---|---|
| C# / .NET | coreclr | C# Dev Kit or C# |
| Python | debugpy | Python |
| Node.js | js-debug (built-in) | None |
| Browser apps | js-debug (built-in) | None |
| Azure Functions | Varies by language | Azure Functions + language extension |
Node.js and browser debugging work out of the box — VS Code includes a built-in JavaScript debugger. C# Dev Kit gives you richer build integration than the standalone C# extension, but either works for debugging. Azure Functions debugging supports C#, JavaScript/TypeScript, and Python.
Extension settings
Section titled “Extension settings”Configure the extension under Settings > Aspire, or jump there with Aspire: Extension settings.
| Setting | Default | Description |
|---|---|---|
aspire.aspireCliExecutablePath | "" | Path to the Aspire CLI. Leave empty to use aspire from PATH. |
aspire.dashboardBrowser | openExternalBrowser | Which browser opens the dashboard — system default, or Chrome/Edge/Firefox as a debug session. |
aspire.enableAspireDashboardAutoLaunch | true | Open the dashboard automatically when you start debugging. |
aspire.registerMcpServerInWorkspace | false | Register the Aspire MCP server (see MCP Server Integration). |
There are more settings for verbose logging, startup prompts, and polling intervals — run Aspire: Extension settings to see them all.
The extension also provides IntelliSense and validation when editing .aspire/settings.json (workspace-level) and ~/.aspire/globalsettings.json (user-level). Use the Open local/global Aspire settings commands to open them.
MCP server integration
Section titled “MCP server integration”The extension can register an Aspire MCP server with VS Code. This lets AI tools — GitHub Copilot included — see your running app’s resources, endpoints, and configuration for better context when helping you write code.
Turn it on by setting aspire.registerMcpServerInWorkspace to true. When enabled, the extension registers the MCP server definition via the Aspire CLI whenever a workspace is open and the CLI is available.
For more information, see Use AI coding agents.
Feedback and issues
Section titled “Feedback and issues”Found a bug or have an idea? File it on the dotnet/aspire repo: